
Maria Homann
Whether you’re considering investing in test automation or you’ve already purchased a tool, understanding the value of test automation is fundamental - not just for your team but also to the wider organization. In this blog post, we’ll cover how you can measure the business value of automated testing to get support from management and budget holders.
Skip ahead to:
Why is it important to know the business value of test automation?
Why should you invest in test automation?
Outline test automation challenges and the business implications
How to quantify the value of test automation
Why is it important to know the business value of test automation?
Asking this question at the start of your test automation tool evaluation and implementation is crucial.
With a sea of vendors to choose from (all with different tangible outcomes) defining the key criteria, such as the implications of doing nothing, the outcomes you expect to achieve, and the measurements that help you track whether you’re achieving them will ultimately help you implement more efficient testing practices.
By identifying the outcomes you can achieve - such as better test coverage, less defects reaching production, and higher agility - your company will be better informed on where and how to invest their resources.
This is powerful knowledge. It will help you get management support (a task that is not the easiest), and it will help you secure a budget. Beyond that, you will be able to empower your teams to align their testing efforts to your overarching business goals.
In this article, we’re going to give you guidance on measuring the business value of test automation (you can also watch this instructive webinar on building your own business value case). At the end of this post, you’ll be able to access a Total Economic Impact™ study commissioned in partnership with Forrester. This study details the return of investment (ROI) and impact a no-code test automation tool can have on your business.

To gain the business value of test automation, why should you invest?
There are many benefits of integrating automated testing within your business processes, however, each of these benefits vary from organization to organization. By uncovering your ‘why’ at an early stage, you’re laying the tracks for successful test automation adoption. Not just to get support for the investment in the first place, but to make sure management will continue putting budget towards it, and support further scaling.
To lay these tracks, you should start by asking three foundational questions:
- What challenges are we trying to address with test automation?
- What is the desired state after having implemented test automation?
- What are the desired outcomes of the investment (to the team and to the business) and how can we measure and quantify those?
In the following, we’ll take a closer look at answering each of these. Make sure to watch our webinar Best Practices: Measuring the Business Value of Test Automation to learn more and to get practical examples of how businesses are estimating the value of test automation that you can apply to your own case.
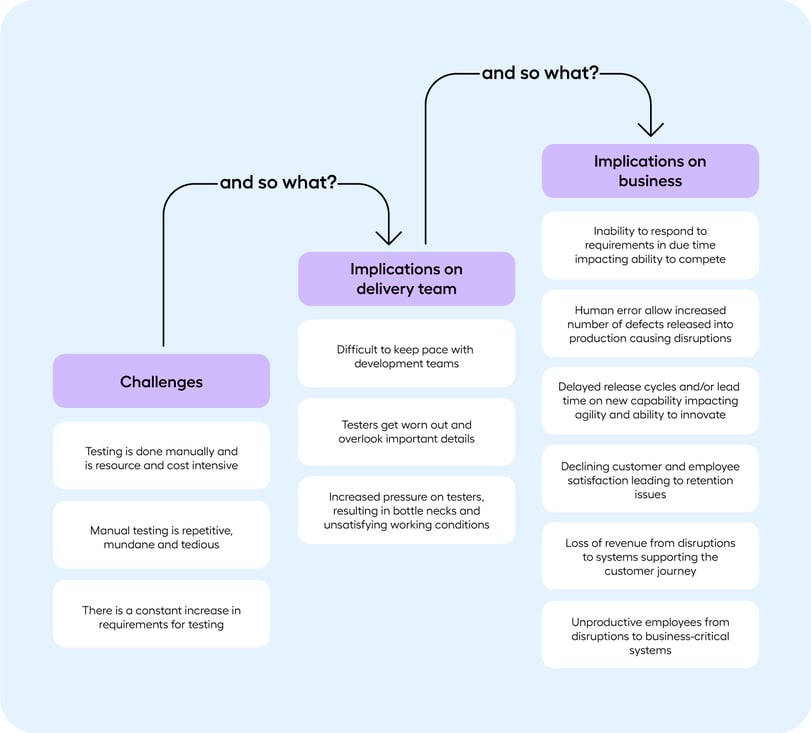
1. Outline the challenges you are trying to address with test automation and what the business implications could be
It all starts at the root of the problem. If you are the one advocating for an investment in test automation within your organization, you probably already have a clear idea of what challenges you’re facing or which issues you’re trying to resolve . Mapping these out is the first step in calculating value.
Challenges for the QA team
In many organizations, the challenge starts with manual testing. Manual testing is resource-heavy and time-consuming, particularly the repetitive types of testing such as regression testing. This has implications for the QA team and the wider business.
For the QA team, it steals time away from important, higher-value work. This means bottlenecks emerge, and it’s hard to keep pace with development and release cycles. Testers get worn down from highly repetitive work, which increases the risk that they’ll overlook something important.
How these challenges impact business
For the business, overworked testers mean errors can slip into the production environment and have negative implications on the product quality. Slow, repetitive testing prohibits agility and the ability to innovate. Bottlenecks mean slow responsiveness to changes in customer demand and the inability to compete in the market.
To some businesses, buggy functionality could mean disruptions to internal and external processes; an employee might not be able to log in to a platform and do their job (disrupting productivity), and a customer might not be able to check out items in their basket (disrupting revenue).
Admincontrol, a Software as a Service (SaaS) provider in the IT space, faced a similar situation. Their business became vulnerable to releasing bugs into production. Major releases increased their regression testing scope, putting huge pressure on their testers. Their solution was to take a more proactive approach. They created a test automation business case that enabled them to implement easy-to-use no-code test automation to their development process.
By implementing no-code test automation, they could keep their regression testing maintenance burden to a minimum, and achieve higher test coverage. As a result, they can release new capabilities at 4x the speed.
These challenges and their implications may vary from business to business, so make sure to map out the ones specific to your case. Mapping out the maturity of your testing strategy can help you complete this exercise.
See the image below for an example of how this can be visualized:
2. Be clear on the desired state and how test automation can help reach it
The next step in quantifying the value of automated testing is uncovering the desired state . Considering what success looks like based on solving the core challenges will help you identify desired outcomes, and later, metrics to measure those outcomes .
The desired state may be a combination of the following points:
- Higher release frequency
- Faster lead time
- Improved overall quality of our product
- Elimination of defects going into production
- When bugs enter production, issues are resolved quickly
- Better test coverage with no added resources
- Greater job satisfaction
These points can then be translated into desired outcomes:
- Improved competitiveness as a result of innovation
- Increased agility
- Low risk of revenue and productivity impact
- Productive workforce
- Improved retention
- Internally (employees): ridding testers of tedious work
- Externally (customers): providing better products and user experiences
- Increased revenue and profitability
3. How to quantify the value of test automation
The last step in measuring and quantifying the value of test automation is aligning the desired outcomes to measurable metrics.
Success isn’t just measured within the QA team either, but across the organization. If, for example, job satisfaction increases as a result of minimizing testers’ repetitive, tedious work, this can be measured in internal surveys and bump up employee satisfaction averages across the organization. Or similarly, if the product quality increases as a result of smoother development cycles, this can be measured through customer satisfaction surveys and help improve product trust and NPS scores.
Equally important is that savings in hours or skilled resources doesn’t have to mean a reduction in headcount. On the contrary, repurposing hours to other disciplines that can bring more value is often a more desirable state, not just for the employees, but for the business. Making this clear in your automation metrics visualization process is key.
In general, when it comes to calculating metrics, it’s key that these are ‘translatable’ as value-drivers for the wider business. Although the meaning may be the same, speaking the language of senior management can be the defining factor that will secure you the budget for your investment.
See below how the outcomes outlined above translate into metrics for the QA team and for business management.
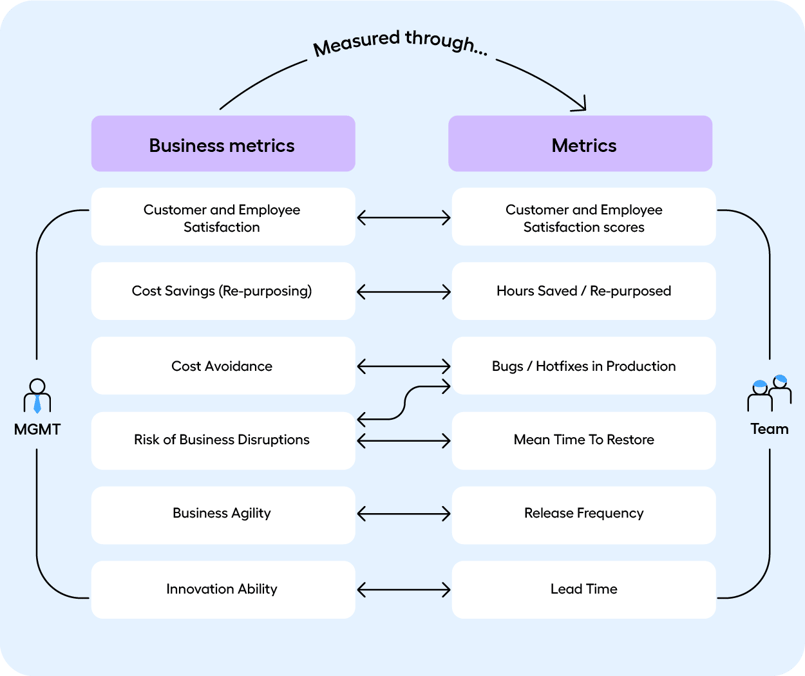
Metrics related to costs and hours can be further translated into Return of Investment (ROI) calculations. (Side note: At this stage, you may be thinking, "okay I can use the above points for measuring the ROI of test automation". Not quite. Bear in mind that ROI is a form of value, but not all value takes the form of ROI. We've written a more detailed post on how to caculate the ROI of test automation.)
Compare the costs of the tool and resources required to implement and use it to the costs you’re saving doing manual testing. When will you break even?
You can use dashboards fed with continuous data to keep track of these metrics in a way that will enable you to see and forecast developments over time.
Dashboards are a good way to visualize positive impact, and keep track of metrics that aren’t moving in the direction you want them to. When this is the case, you can more easily pinpoint the root of the cause with visual insights that show you when and where undesired spikes occurred.
Learn more about measuring the value of test automation with Leapwork
Measuring value should be a core part of any investment and ROI calculation. We’ve commissioned this Total Economic Impact™ study alongside Forrester, where you can access key information on how Leapwork’s no-code test automation approach can help you achieve a 209% ROI.
