Workflow Management
Workflow Management “brings Leapwork’s Teams functionality to life” with new capabilities that make it easier to govern and collaborate across larger teams and multiple automation projects. Workflow Management provides improved version transparency, contributor tracking, approvals and handover. In this way, customers can track what work is in progress, what needs to be reviewed, and what has been approved by whom, making it easier to manage 100s/1000s of flows throughout their entire lifecycle.
With Workflow Management, customers can:
-
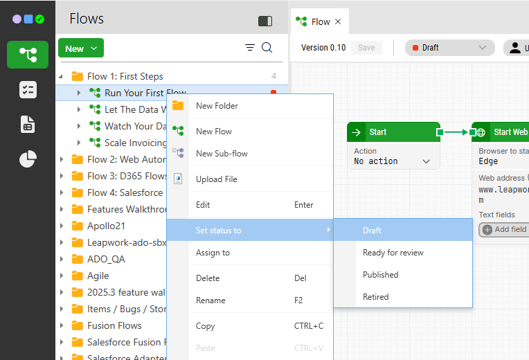
Save flows in different states (in “draft”, “assign for approval”, “publish”, “retired”)
-
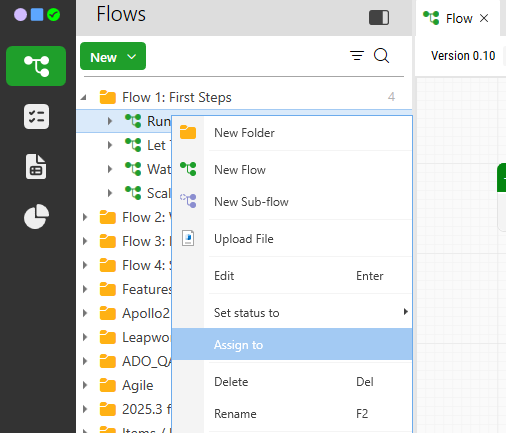
Assign flows to the right owners or change an assignee for a flow or sub-flow
-
Segregate duties
-
Notify users of the consequence of an action before it is done
-
Get an instant overview of revision state
-
Get improved versioning for immediate progress transparency
-
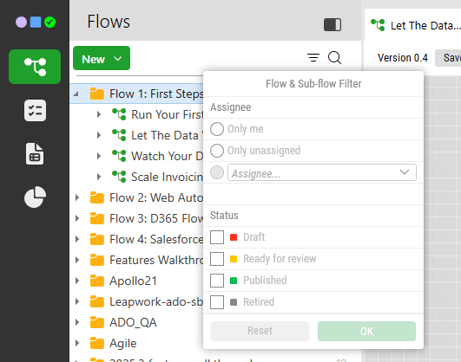
Filter flows and sub-flows by assignee
-
Filter flows and sub-flows by progress status
-
Bulk update the status of flows
Track progress and responsibilities easily, with the new Leapwork toolbar
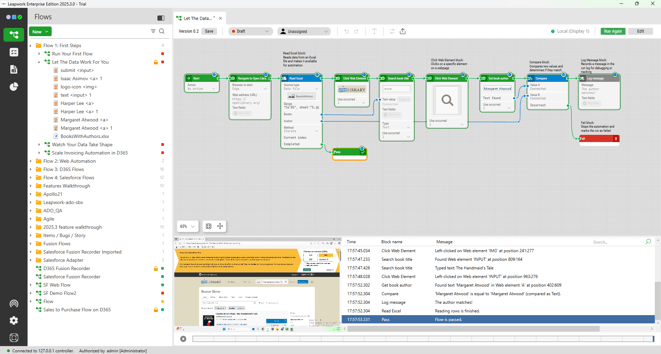
Workflow Management functionality will present itself in the new Leapwork toolbar, which users will now find at the top of the Studio canvas. Here, you will get an instant overview of revision state, assignee, and version number. Users can therefore immediately see the current flow state and apply changes to it if they have the relevant permissions:
Enterprise-grade versioning
For every change a contributor makes, the flow can be set to “Ready for review” and assigned to a different team member with the correct role. When this happens, the flow's minor version number will increase (e.g. from 1.1 to 1.2 or 2.6 to 2.7). When a flow is published, the major version number will increase by one (e.g. from 1.0 to 2.0), whilst the minor version number will reset to 0:
Crucially, this means it is now possible to configure Run Lists to only use published flows with a major version number. This enables users to edit or mature flows using minor versioning whilst the published flow runs as usual.
Preview Runs
An important part of making an automation flows robust and reliable is to be able to preview the flow as it is being built. This gives you a chance to test the flow and correct issues as you go.
To do a Preview Run of a flow, simply click on the ‘Run’ button available in the top header of the Design Canvas:

This will run the flow on the local machine, enabling easy debugging and verification. When the ‘Run’ button is clicked, Leapwork Studio will minimize and the flow will start running. Once the flow ends – in either passed or failed state – Leapwork Studio will maximize so you can make the necessary changes.
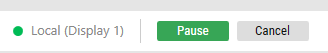
The preview run can now also be paused and resumed at any time, allowing you to do your analysis and inspection of recent changes immediately – you do not need to wait for the flow to complete the run:
Every building block also includes a blue data container (we call this a “data item”), which reveals critical insights relevant to a specific building block’s activity as part of the flow. New accessible insights include:
- Data values from the application under automation
- Data driven from external sources
- Applied building block parameters, settings, and attributes
This means it’s not only straightforward to identify which element of the flow has failed, but it is now quicker to diagnose why - on a data level - it has failed.
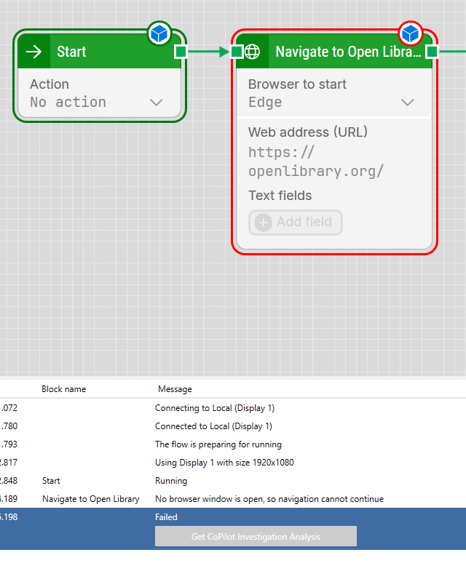
After a Preview run, the Preview pane is available. It consists of three elements:
-
A video recording of the entire run of the flow: Simply click on the play button in the video player to review the entire run.
-
A debug version of the Design Canvas, where the active building block is highlighted with an orange border.
-
The Activity log containing valuable debug information from the individual building blocks.
All three elements are correlated and can be inspected simultaneously. For example, when you press play an orange border will appear around the corresponding building block and the highlighted element in the Activity Log will change accordingly - indicating precisely what is happening and when.
Selecting an element in the Activity Log will move the video to the corresponding moment in the recording:
The combination of the debug view, the video, and the activity log is a powerful and intuitive tool for identifying reasons for failure and for handling unexpected behavior.
To go into edit mode again after a Preview run, click the ‘Edit’ button, which is available oi the top header of the Design Canvas, or simply double-click on the grayed out Design Canvas.
Administrators can begin the day by filtering the asset tree view to show all flows assigned to them. This makes it easy to review flows and either approve for production and publish or return them to the senders with instructions for improvement:
Note: These capabilities are available in the Enterprise Edition only.