Reporting
Reporting allows users to easily monitor and evaluate the state of their automation flows across projects, products, business units, etc. All execution results - both preview runs, manually triggered schedules and API-triggered schedules - can be accessed in the reporting section.
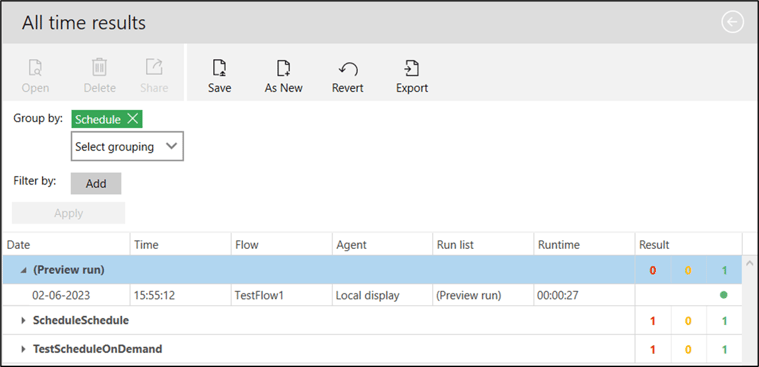
The report shows the result of the automation flow runs using ‘traffic-light’ indicators. Red for failing, yellow for done/unknown, and green for successful flow runs.
Creating a report
When the reporting section is opened for the first time it will by default contain two reports: 'All time results' and 'Results by project this week'.
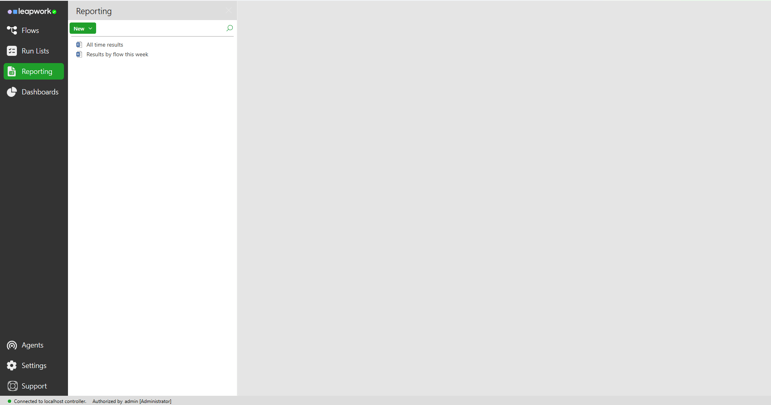
To create a new report, click on the ‘New’ button and select ‘Report’ to open the ‘Create New Report’ dialogue.
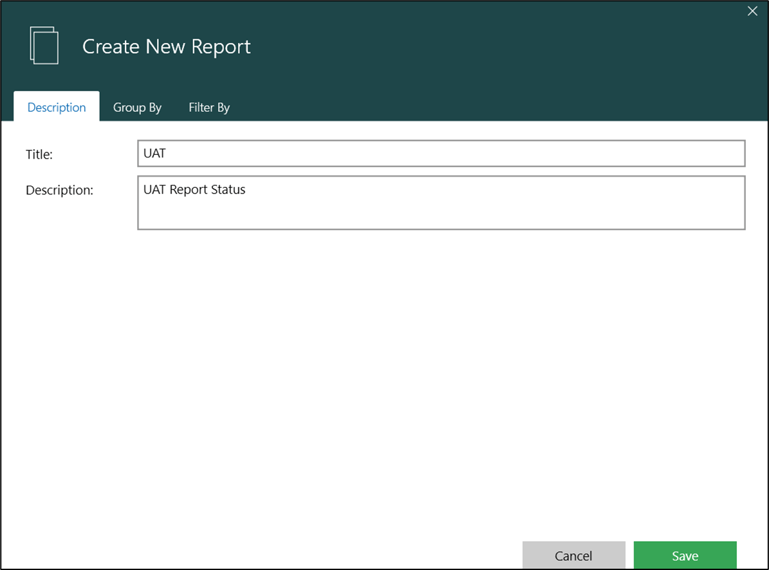
Give the report a title and a description.
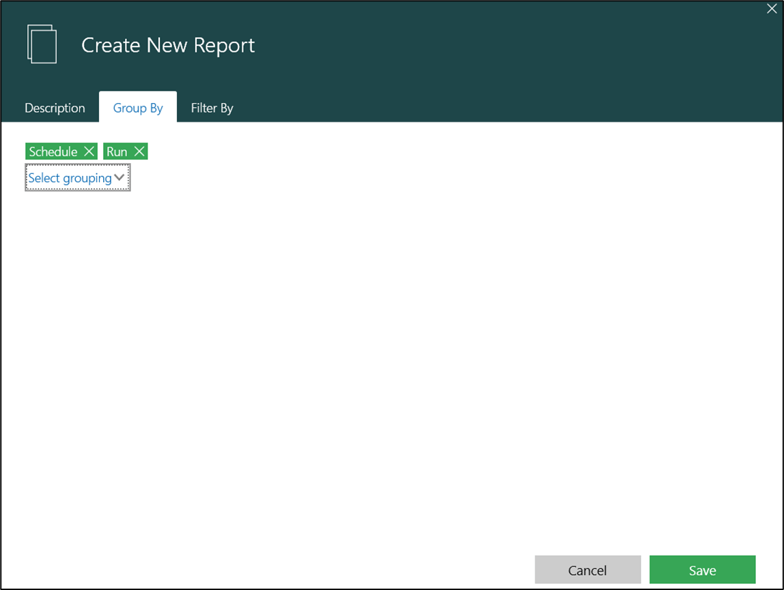
On the 'Group By' tab, select one or more fields to group the results by. In the example below, the name of the Schedule which executed the automation flows, is chosen as the first grouping field. The "Run" - the individual run of the schedule is chosen as the second group category. It is possible to add multiple grouping fields, creating a drill-down view in the report.
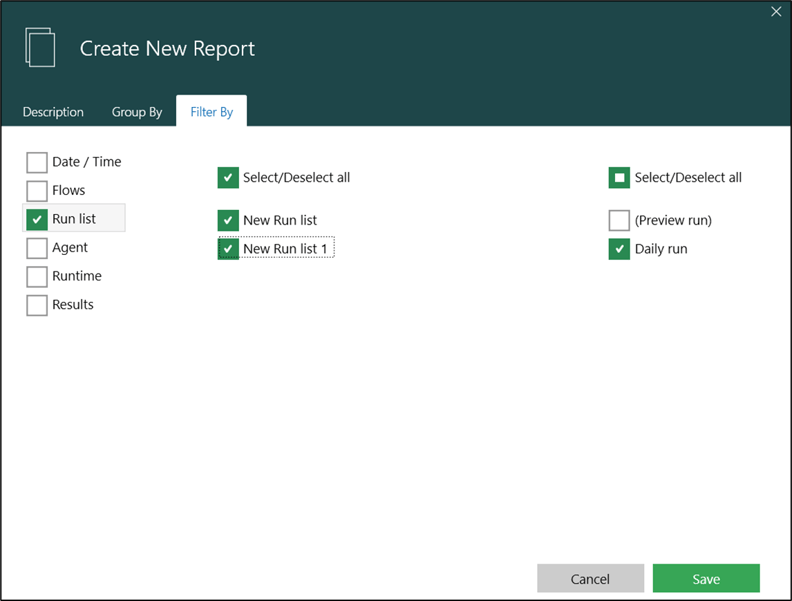
On the 'Filter By' tab, specify the conditions to filter the flow run results by. In the example below, the report will only show results from automation flows that was executed as part of the run list named as ‘New Run list’ and schedule named as 'TestSchedule'.
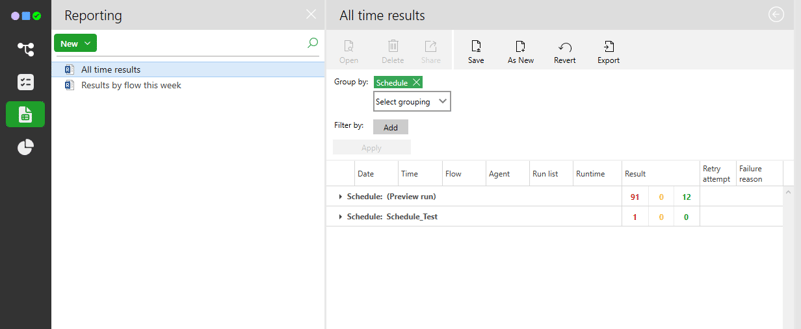
Click ‘Save’ to close the dialogue. Now the new report is shown in the report list in the left pane and the traffic-light view in the middle panel.
Result Overview
Click on the reports in the list in the left pane to open a report, and use the defined groups/categories to navigate to the details of the flow runs.
The amount of failed, done, and successful runs is automatically summarized for each level of the groupings providing a fast overview of the state of the automation runs.
The data part of a report can be exported into PDF, Excel, or HTML by clicking ‘Export’.
Automation run details
Click on a report entry to get more information about a specific run of an automation flow. This will open in the right pane in the reporting section. The details view consists of three elements:
- A video recording of the entire run of the flow. Simply click on the play button in the video player to review the entire run.
- A debug version of the Design Canvas, where the active building block is highlighted with an orange border.
- The Activity log containing valuable debug information from the individual building blocks.
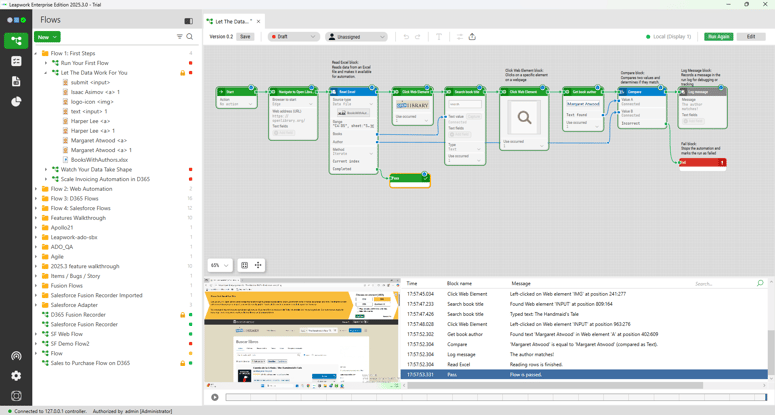
All three elements are correlated and can be inspected simultaneously, so scrubbing the video will make the orange border move between the building blocks on the Design Canvas and will make the highlighted element in the Activity log change accordingly. Selecting an element in the activity log on the other hand, will move the video to the time where the activity log entry was added.
The combination of the debug view, the video, and the activity log is a very powerful and intuitive tool for finding failure reasons and for handling unexpected behavior in the flows.
The recorded videos are saved as AVI files and can be accessed directly on the Controller machine depending on the security settings for the Controller machine. To get a direct link for a video, right-click the video and select ‘Get video file link’. The direct link to the video is now copied to the clipboard and can be inserted into e-mails, etc.